DIRECT ANSWER · 16 MIN READ
Gold rises or falls when the balance of buyers and sellers changes
Gold usually rises when falling real yields, a weaker U.S. dollar, greater uncertainty or stronger investment and reserve demand make bullion more attractive at the current price. It usually falls when real yields or the dollar rise, risk demand fades, investors reduce positions or price-sensitive physical demand weakens. These forces can conflict, so no indicator explains every move.
They can reprice in seconds after new information.
Persistent buying can change the market balance.
High prices can reduce buying and release supply.
One driver is evidence, not a complete explanation.
TRANSMISSION MAP
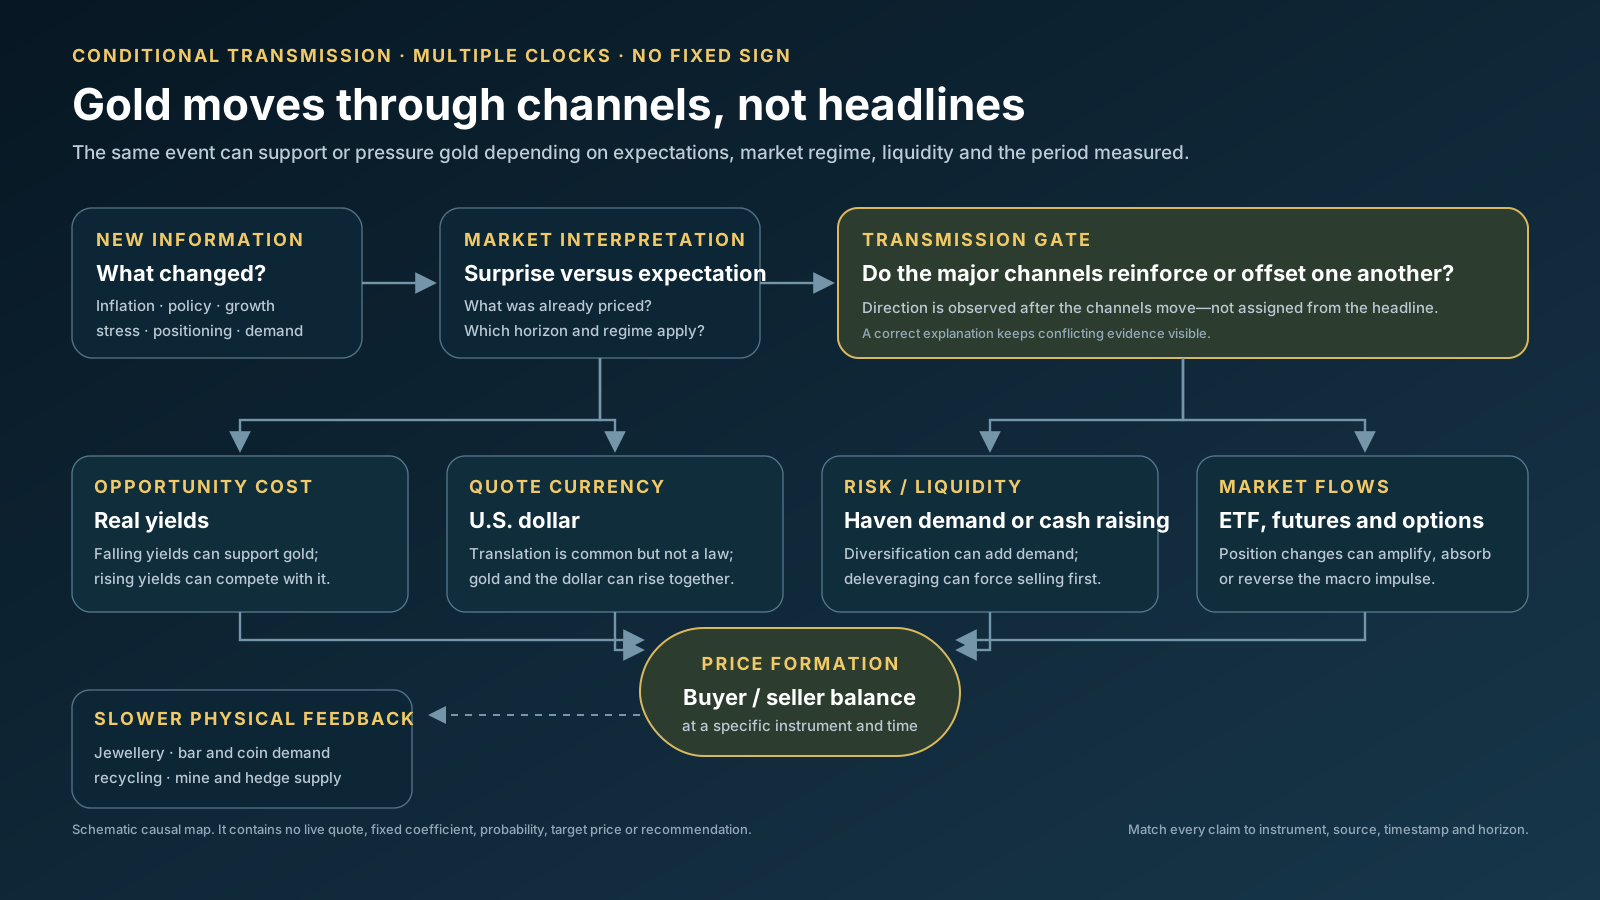
The headline matters only through the channels it changes
Begin with the surprise relative to expectations, then trace real yields, the dollar, risk and liquidity, and observable market flows. These channels can point in different directions, and slower physical demand, recycling and mine supply should not be forced onto an intraday clock.
INTERACTIVE DRIVER LAB
Build a scenario without pretending it is a price forecast
Select the conditions that best describe the period you are studying. The worksheet groups them into four channels—economic expansion, risk, opportunity cost and momentum—then shows whether your assumptions lean supportive, mixed or adverse for gold. It deliberately produces no target price.
This worksheet classifies the assumptions you selected. It is not a regression model, target price, probability estimate or investment recommendation.
THE CORE MODEL
Start with opportunity cost, then add demand and supply
Gold pays no coupon. Higher inflation-adjusted bond yields increase the return available from competing safe assets; lower real yields reduce that disadvantage.
Because the global reference is commonly quoted in U.S. dollars, a stronger dollar can make gold more expensive for other-currency buyers and pressure XAU/USD.
Financial stress, geopolitical uncertainty and concern about institutions can increase diversification demand, although a cash scramble can initially force selling.
ETF creations and redemptions, futures positioning, options hedging and trend-following can reinforce or reverse the underlying macro impulse.
This is a causal map, not an equation with fixed coefficients. The strength, delay and even sign of each relationship can change by market regime. Use the gold market drivers framework to record competing explanations instead of choosing the most convenient headline.
SEVEN MAJOR DRIVERS
What typically pushes gold up or down
“Often” matters. Gold and the dollar can rise together, high inflation can coexist with falling gold, and official buying can be absorbed without an immediate rally. Relationships are conditional, not laws.
TIME HORIZONS
The dominant cause changes with the period being measured
Gold is a stock-heavy market: most gold ever mined still exists in a form that can potentially return to market. That makes changes in the willingness of existing holders to buy or sell important alongside each year's mine production.
NEWS-TO-PRICE TRANSMISSION
Why the same inflation headline can produce opposite moves
If inflation concern lowers expected real returns or weakens confidence in policy, real yields may fall and gold may rise.
If traders expect higher policy rates, real yields and the dollar can rise. Gold may fall even though reported inflation is higher.
Investors may add gold as a portfolio diversifier, supporting price alongside government bonds or the dollar.
Margin calls and a rush for cash can lead investors to sell liquid gold exposure first; safe-haven demand may appear later.
The useful question is not “Was the news good or bad for gold?” It is “How did the news change expected real returns, currencies, risk preferences and actual market positions?”
CURRENT EVIDENCE SNAPSHOT
One quarter can contain opposing demand signals
The World Gold Council's Q1 2026 demand report estimated total gold demand including OTC at 1,231 tonnes. Bar-and-coin demand reached 474 tonnes, gold-backed ETFs added 62 tonnes and central banks bought 244 tonnes on a net basis. At the same time, jewellery demand volume fell 23% year over year as record prices reduced affordability. The point is not that one category “won”; it is that price formed while investment, official-sector and consumer channels moved differently.
Including OTC, Q1 2026 estimate.
Second-highest quarter in the published series.
Estimated net purchases during the quarter.
Higher prices constrained physical consumption.
Source: World Gold Council, Gold Demand Trends Q1 2026, published April 29, 2026. Estimates can be revised and some official-sector activity is inferred rather than reported immediately.
COMMON ANALYTICAL ERRORS
Five explanations that sound plausible but are incomplete
LOCAL AND PHYSICAL GOLD
Your gold price may move differently from XAU/USD
A local-currency gold price combines the U.S.-dollar gold price with the exchange rate. If the local currency weakens, local gold can rise even when XAU/USD is flat. A bar or coin then adds product premium, payment cost, shipping, tax where applicable and a dealer spread. Use the currency and gold guide for the exact compound-return formula, and the buy/sell spread calculator for transaction economics.
REPRODUCIBLE WORKFLOW
How to explain a gold-price move in ten checks
01Define the exact instrument, currency, unit, source and start/end timestamps.
02Calculate the move rather than relying on the chart's visual slope.
03Check nominal yields, inflation compensation and real yields over matching dates.
04Check the broad U.S. dollar and the relevant bilateral exchange rate.
05Record the economic surprise relative to expectations, not only the published number.
06Review ETF holdings, futures positioning and signs of forced liquidation or momentum.
07Separate immediate risk demand from longer-lived reserve or portfolio allocation.
08Add physical demand, recycling and mine supply only at a frequency the data support.
09Write a competing explanation and identify evidence that would reject your first story.
10State the limitations: correlation is not proof, and a framework is not a forecast.
WHAT CHANGES THE ANSWER?
The dominant driver can rotate without warning
- A strong payroll report may pressure gold if it raises real yields, but support it if markets focus on inflation or fiscal risk.
- A weaker dollar may support XAU/USD while a stronger local currency limits gains for a non-U.S. buyer.
- ETF inflows can reinforce a rally, but high prices may simultaneously reduce jewellery demand and increase recycling.
- Central-bank accumulation can support a long-run thesis while having little explanatory value for one intraday move.
- A falling gold price can still leave a physical owner with a gain if the local currency weakens enough or the purchase basis was lower.
PRIMARY SOURCES & METHOD
Use data that matches the claim
- Federal Reserve TIPS yield curve and inflation compensation for official real-yield definitions and daily model data.
- Federal Reserve H.10 dollar indexes for broad, advanced-economy and emerging-market currency measures.
- CFTC Commitments of Traders explanatory notes for position categories, reporting frequency and limitations.
- LBMA daily auction price documentation for benchmark timing, quote basis and licensing boundaries.
- World Gold Council Q1 2026 Gold Demand Trends for the current demand-and-supply snapshot used above.
- GoldObserve methodology for market-price normalization, observation times, units, FX and unavailable states.
GoldObserve does not republish protected benchmark histories here. The driver worksheet records user assumptions; it is not the World Gold Council's proprietary attribution model, a regression, a probability estimate or investment advice.
RELATED RESEARCH
Test each part of the explanation
FAQ
Questions about why gold moves
What is the main cause of gold price changes?
There is no permanent single cause. Short-run moves often reflect real yields, the dollar, risk and flows; longer periods add reserve demand, physical demand, recycling and mine supply.
Does inflation always make gold rise?
No. If inflation leads markets to expect tighter policy, real yields or the dollar may rise and gold may fall. The policy and market response matters more than the CPI headline alone.
Why can gold fall during a crisis?
Investors may sell liquid positions to raise cash or meet margin calls. A stronger dollar or higher real yields can also outweigh safe-haven demand.
Can gold and the U.S. dollar rise together?
Yes. Severe risk events, reserve diversification or strong non-U.S. demand can support both. The inverse relationship is useful context, not a mechanical rule.
Do central banks control the gold price?
No. Their purchases or sales can be important, but global price discovery still reflects many participants across OTC, futures, exchange-traded and physical markets.
What should I track every day?
For a short-run explanation, start with the gold return, real yields, the broad dollar, the news surprise and market flows. Add slower physical and official-sector data only when the reporting period matches.