THE SHORT ANSWER
Choose the job first; then compare the friction
Gold is usually the more compact monetary and store-of-value holding; silver is the lower-priced metal with greater industrial exposure and far more physical mass for the same budget. That does not make one automatically safer or more profitable. Live ownership costs and licensed historical evidence answer different questions: product quotes show executable friction, while matched World Bank monthly averages show how the two metals actually moved through time.
More quoted value in fewer fine ounces.
Electronics, photovoltaics and other manufacturing uses.
A measurement, not a trading signal.
Executable costs can reverse the spot-only answer.
EQUAL-BUDGET OWNERSHIP CALCULATOR
Compare what the same cash amount actually buys
Use identical budgets so price level does not distort the comparison. Live mode requests gold and silver separately and preserves each provider and observation time. The cost fields deliberately begin at zero premium, zero storage and a 100% spot buyback reference; these are neutral arithmetic settings, not claims about market quotes.
Gold and silver source status
Gold and silver are requested, timed and failed independently. A valid observation for one metal never supplies or validates the other.
- Source
- No provider
- Observed
- Observation time unavailable
- Age
- Checking age…
- Delivery
- No data layer available
Waiting for a source-labelled gold observation.
- Source
- No provider
- Observed
- Observation time unavailable
- Age
- Checking age…
- Delivery
- No data layer available
Waiting for a source-labelled silver observation.
Cost inputs start at a neutral reference, not invented market averages. Replace zero premiums and storage rates, and 100% buyback ratios, with same-time written quotes. Tax, shipping, insurance, fabrication and product size remain outside unless included in your inputs.
Enter positive gold and silver prices and valid cost assumptions to compare the two metals.
DECISION MATRIX
Gold and silver solve overlapping but different problems
RELATIVE VALUE
The gold-silver ratio is a ruler, not a verdict
A rising ratio means gold outperformed silver over the selected move; a falling ratio means silver outperformed gold. It does not reveal whether both prices rose, both fell or one moved alone. A high observation is not proof that silver is undervalued, and there is no fixed “correct” ratio that forces convergence.
For a physical switch, replace spot prices with net sale proceeds and all-in acquisition costs. The amount of silver a dealer will deliver after selling gold can be materially below the spot ratio because of two spreads, product premiums, fees and tax treatment.
PHYSICAL SCALE
Equal value can create radically unequal handling
Before premiums, an equal budget buys silver ounces in approximately the same proportion as the spot gold-silver ratio. If the ratio is 80, the silver position has roughly 80 times the fine mass of the gold position. Premium differences alter the exact amount. Packaging, product count and gross weight can increase the real handling gap further.
More items and mass can change safe capacity, concealment and insurance needs.
Compare minimums, fixed fees and value- or weight-based charges.
Shipping, insurance and dealer acceptance can differ by quantity and product.
Large silver volume may require more lots or counterparties; gold can still face authentication and spread risk.
LBMA wholesale specifications illustrate the physical difference, not a retail recommendation: a current Good Delivery gold bar contains 350–430 fine troy ounces, while a current silver bar targets 1,000 troy ounces with a 10% tolerance. Retail bars and coins are different products and are not automatically Good Delivery.
DEMAND CHANNELS
Silver carries a stronger manufacturing cycle into the price
USGS identifies silver uses across electrical and electronics, photovoltaics, other industrial applications, photography, brazing and soldering, as well as bars, coins, medals, jewelry and silverware. That mix can connect silver to manufacturing investment, technology deployment and substitution decisions as well as investor flows.
Gold also has electronics, aerospace, medical and other technical uses, but its market role more visibly includes jewelry, investment and official reserves. The distinction is not “industrial versus non-industrial.” It is a difference in degree and in which demand channels can dominate at a particular time.
PRICE AND DRAWDOWN RISK
Lower price per ounce does not mean lower risk
Risk should be measured as percentage loss, volatility, drawdown, liquidity and position size—not the number printed beside one ounce. A lower-priced silver ounce can move more sharply in percentage terms. Gold can also experience long drawdowns and does not produce contractual interest, dividends or rent.
LICENSED MONTHLY RETURN LAB
Compare how gold and silver actually moved, not just the latest ratio
The phase map separates direction from relative performance. It uses exact matched months from the World Bank Commodity Price Data (Pink Sheet), so a user can inspect the month, source values, derived returns, historical volatility and drawdown without treating a high or low ratio as a prediction.
MONTHLY RETURN BEHAVIOR
When did gold and silver move together—or split apart?
Zero lines separate rising and falling months. The diagonal answers a different question: points above it are months when gold outperformed silver; points below it are months when silver outperformed gold.
How to read it: the zero axes show direction; the diagonal shows relative performance. A point in “both fell” can still sit above the diagonal when gold declined less than silver. Pointer, touch, Home, End and arrow keys all select an exact month.
13.0% annualized monthly volatility · -39.3% maximum drawdown
26.1% annualized monthly volatility · -67.0% maximum drawdown
Interpretation boundary. Monthly averages are historical reference observations, not executable product returns. The chart excludes premiums, bid-ask spreads, storage and taxes. Volatility, drawdown and past co-movement do not predict which metal will perform better.
PRODUCT CHOICE
Compare fine metal, then compare the product wrapper
Gold and silver are not the whole ownership decision. A coin or bar is a physical product; an ETF or ETP is a documented market interest; a futures position is a margined contract with its own expiry and settlement rules.
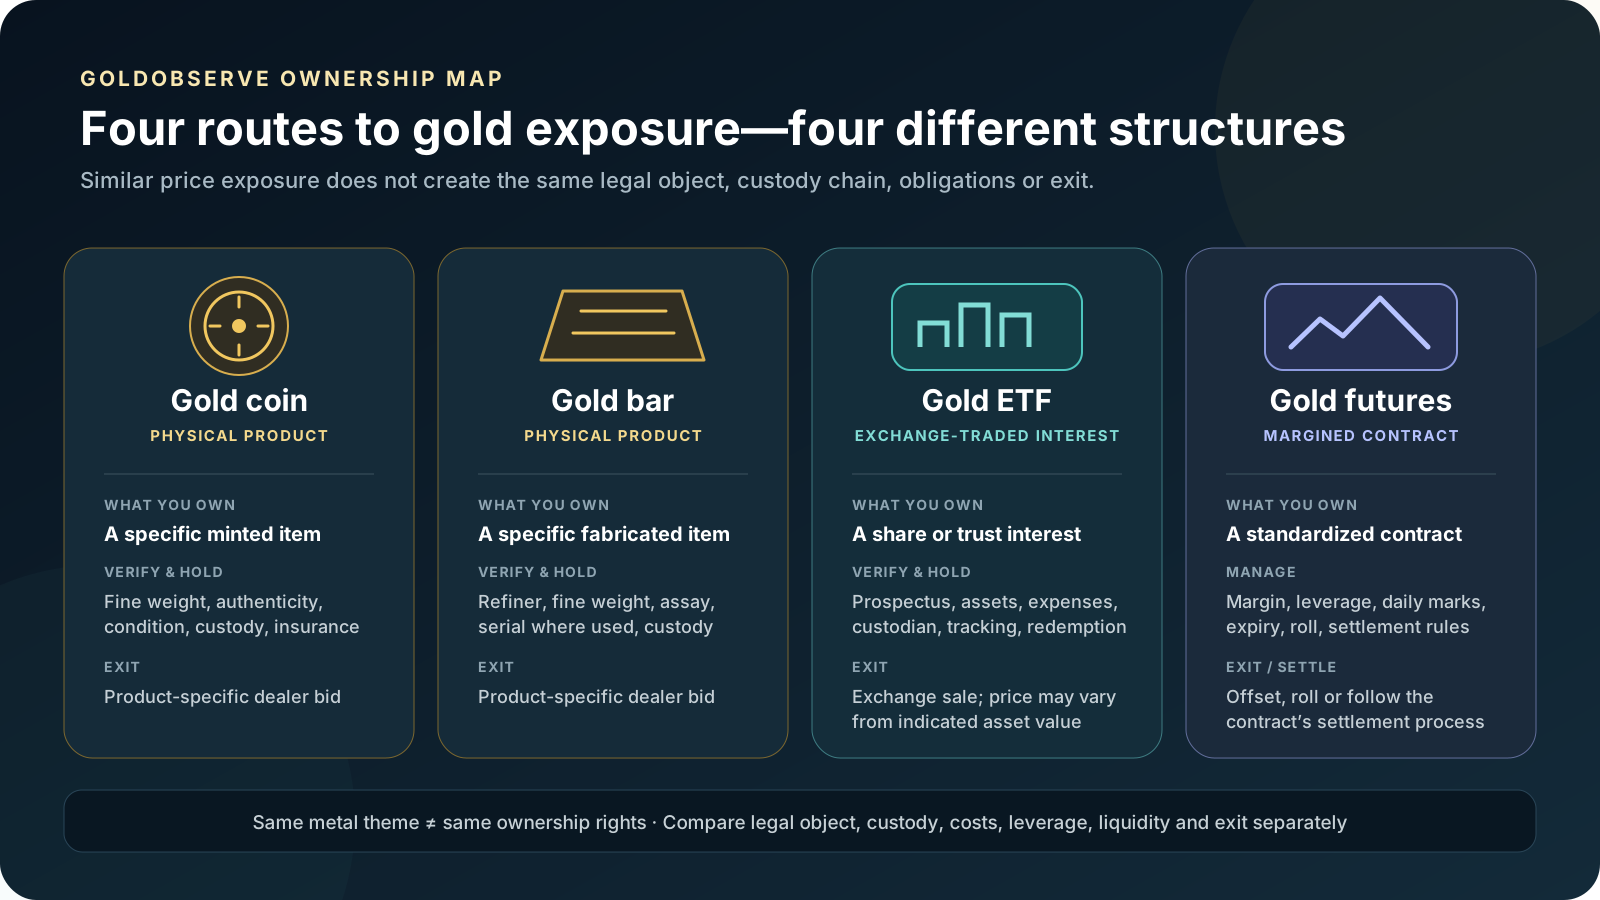
Structure boundary: This schematic compares rights, access and obligations across wrappers; it is not a recommendation, a live product comparison or proof that any fund, contract or dealer provides a particular redemption route.
01Verify fine-metal content from an official mint, refiner, assay or recognized specification.
02Record dealer ask, payment surcharge, tax, shipping and insurance for the full quantity.
03Obtain a same-time buyback bid for the exact product, condition and quantity.
04Confirm storage pricing basis: fixed, per item, by mass or by declared value.
05Test withdrawal, delivery, authentication and resale before committing a large holding.
06Keep collectible value separate unless you can support it with a real specialist market.
CFTC consumer guidance recommends comparing actual weight with spot, asking for all fees in writing and obtaining the dealer's buyback price. A low advertised premium is incomplete if payment, delivery, storage or resale terms are worse.
PORTFOLIO ROLE
Equal ounces are not equal allocation
Portfolio weights must be calculated from current value. Ten ounces of gold and ten ounces of silver can leave nearly all the metal allocation in gold because the price per ounce differs so much. Decide whether the goal is diversification, crisis liquidity, inflation sensitivity, tactical relative value or physical savings, then size the position against the entire portfolio.
The answer can reverse. A storage-constrained owner may prefer gold even when silver's product premium is lower. A buyer seeking a smaller nominal entry or deliberate industrial sensitivity may accept silver's additional mass and price variability. Someone unable to tolerate a deep drawdown may need less of either metal rather than choosing between them.
PRIMARY SOURCES AND MODEL BOUNDARY
The page uses official definitions, live references and user assumptions
- USGS Mineral Commodity Summaries 2026 and its silver chapter for current documented industrial, physical-investment and jewelry use categories.
- USGS gold overview for monetary, jewelry, electrical-electronic, aerospace, medical and chemical uses.
- LBMA Good Delivery technical specifications for current wholesale gold and silver bar weight, fineness and marking boundaries.
- CFTC physical precious-metals advisory for spot, dealer spread, written fee and buyback checks.
- World Bank Commodity Price Data (The Pink Sheet) for licensed monthly gold and silver averages, distributed under CC BY 4.0 and normalized by GoldObserve.
- GoldObserve methodology for provider, timestamp, normalization, stale and unavailable rules.
The calculator holds current metal value constant when estimating simple storage cost and preserves the entered buyback-to-spot ratio for conditional break-even. The historical lab separately derives returns from approved World Bank monthly averages. Neither layer models future premiums, interest, opportunity cost or price probability, and neither claims that one metal will outperform.
RELATED TOOLS
Continue from comparison to live value and allocation
FAQ
Gold versus silver questions
Is gold or silver a better investment?
Neither is universally better. Gold may fit a buyer who prioritizes value density, established monetary demand and lower physical mass. Silver may fit a buyer who accepts greater industrial and price sensitivity, more physical volume and potentially different retail spreads. Product, costs, time horizon and role in the wider portfolio can reverse the answer.
Why is silver usually more volatile than gold?
Silver combines investment demand with substantial industrial use and trades at a much lower price per ounce. Changes in manufacturing demand, inventory, investment flows and market liquidity can therefore produce large percentage moves. Volatility is historical behavior, not a guarantee about the next period.
What does the gold-silver ratio mean?
It is gold price per troy ounce divided by silver price per troy ounce on a comparable currency, unit and timestamp basis. A ratio of 80 means one fine ounce of gold has the quoted metal value of 80 fine ounces of silver. It does not say either metal is cheap or about to reverse.
Why do equal budgets buy so much more silver mass?
Silver's price per fine ounce is much lower. Before premiums, the fine-ounce mass ratio for equal budgets is the gold-silver price ratio. Retail premiums can change the executable quantity.
Do gold and silver premiums work the same way?
No. Premiums depend on product size, fabrication, inventory, payment, dealer and quantity. A percentage premium on low-priced silver can behave differently from a gold premium, while shipping and storage can matter more for a larger physical mass.
Should I use spot price or dealer prices?
Use spot for a transparent metal reference and same-time executable ask and buyback quotes for a purchase decision. Spot does not include fabrication, dealer margin, tax, shipping, insurance, storage or resale deductions.
Can I hold both gold and silver?
Yes, but allocation should be based on market value and a defined purpose, not equal ounce counts. GoldObserve's portfolio calculator values each metal separately, tests independent price scenarios and shows allocation drift.
Does historical behavior predict the better metal?
No. The historical lab uses licensed World Bank monthly averages from 1960 onward and calculates matched-month returns without interpolation. It describes observed volatility, drawdown and leadership; it does not predict future returns or include executable product costs.