THE SHORT ANSWER
Reserve value and gold holdings are different questions
World Bank WDI publishes annual reserve values in current U.S. dollars. GoldObserve keeps the two official indicators separate, then calculates their same-country, same-year difference so the reader can see the implied gold component in value terms. It is a context layer for research, not proof of how many tonnes a country owns or whether it bought gold that year.
Nominal reserve value, not tonnes.
Yearly observations, not daily flow.
Including gold minus excluding gold.
Explicit coverage, not global total.
ANNUAL TIME SERIES
United States: reserve context over time
This series answers how the selected official reserve measure changed in current USD. It does not show physical gold tonnage, a monthly path, a central-bank purchase, or a forecast.
| Year | Value | Status |
|---|---|---|
| 2000 | $128.4B | Observed |
| 2001 | $130.08B | Observed |
| 2002 | $157.76B | Observed |
| 2003 | $184.02B | Observed |
| 2004 | $190.46B | Observed |
| 2005 | $188.26B | Observed |
| 2006 | $221.09B | Observed |
| 2007 | $277.55B | Observed |
| 2008 | $294.05B | Observed |
| 2009 | $404.1B | Observed |
| 2010 | $488.93B | Observed |
| 2011 | $537.27B | Observed |
| 2012 | $574.27B | Observed |
| 2013 | $448.51B | Observed |
| 2014 | $434.42B | Observed |
| 2015 | $383.73B | Observed |
| 2016 | $405.94B | Observed |
| 2017 | $451.29B | Observed |
| 2018 | $449.91B | Observed |
| 2019 | $516.7B | Observed |
| 2020 | $628.37B | Observed |
| 2021 | $716.15B | Observed |
| 2022 | $706.64B | Observed |
| 2023 | $773.43B | Observed |
| 2024 | $910.04B | Observed |
| 2025 | $1.39T | Selected |
COUNTRY COMPARISON
Implied gold component by selected year
The bars are the same-year arithmetic difference between the two World Bank indicators. They are a screening context, not official gold holdings or a ranking of central-bank buying.
Source: World Bank WDI, sourced from IMF International Financial Statistics. Annual observations through 2025.
Data verification detailsVersion identifier for reproducing this local series
Normalized data SHA-256: f5152c1f933cdedc696b612c501f992f2a512ba32ea3e86ce3b1002084f36582.
RESERVE OPERATING MODEL
A stock can change through more than purchases and sales
Separate custody quantity, valuation basis, reporting perimeter and publication version before interpreting a reserve series. A higher reported value can reflect price, exchange rates, scope or revision as well as a quantity change.
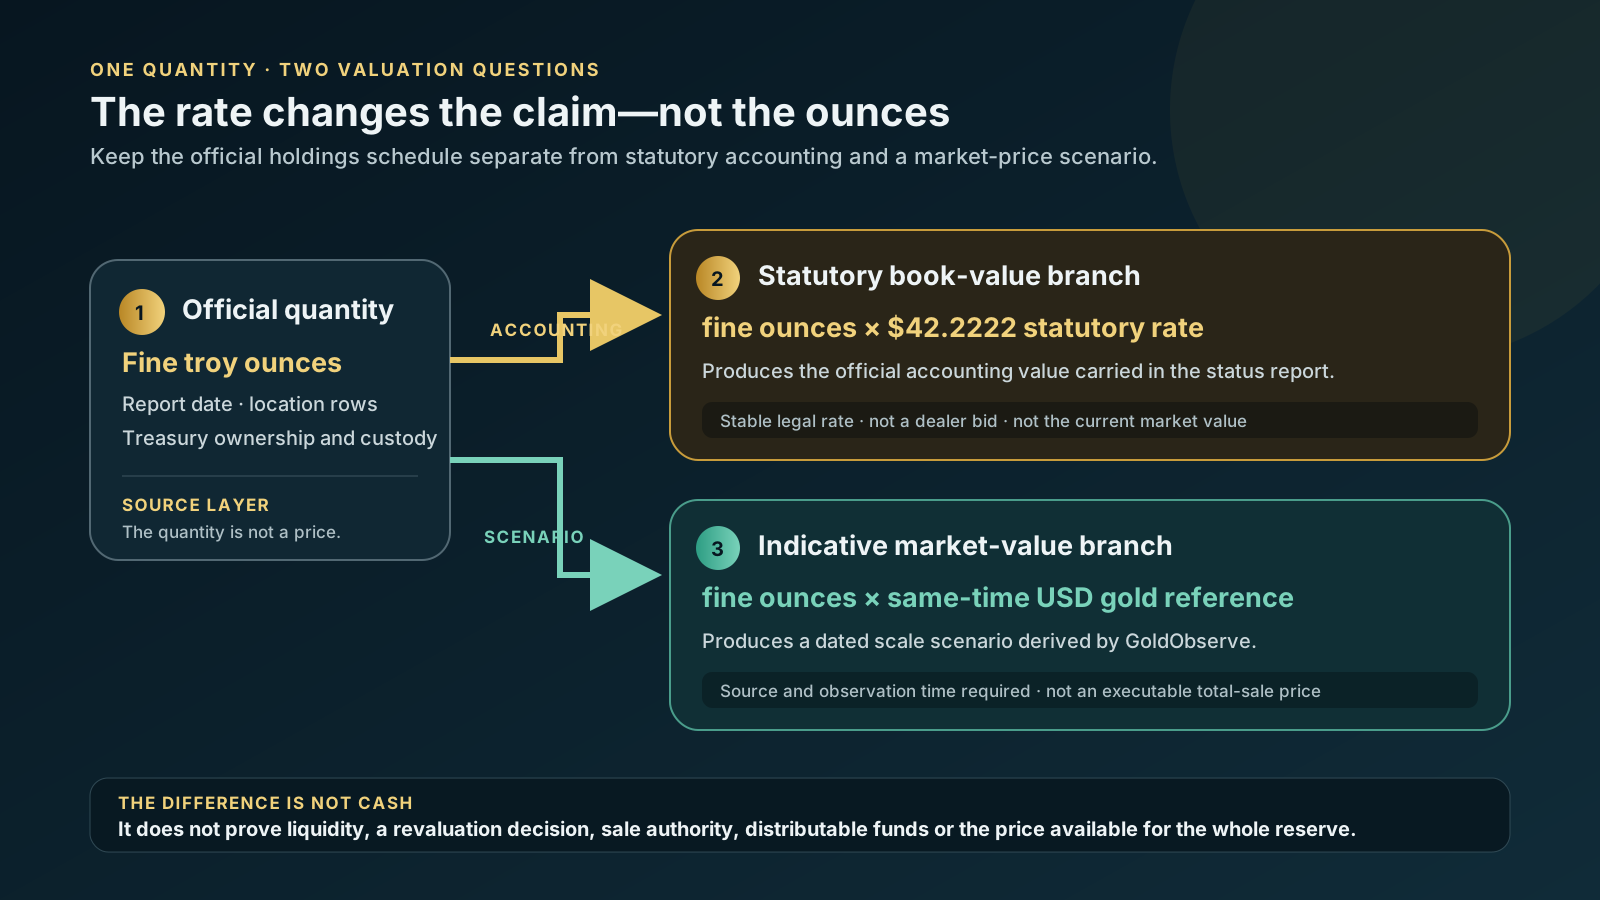
Interpretation boundary: The diagram is a research sequence, not evidence that a central bank bought or sold gold in a particular period.
IMF IRFCL VERSION EVIDENCE
Two official dataset versions are comparable, but they do not prove buying or selling
GoldObserve retained a normalized comparison of IMF IRFCL versions 11.0.0 and 12.0.0. It proves that the official publication changed; it does not by itself establish complete country coverage or central-bank purchases and sales.
These two releases are useful for tracking publication changes. A complete global increase/decrease table still needs broader comparable coverage and a clearly documented reuse basis.
Reproduction detailsVersion status and proof hash
Local version comparison approved. The broader reserve baseline remains unpublished. Proof SHA-256: 1f3c78f3416ac650ba2096c0562c2f3062be681032d95a762e5a75d3ffd9a590.
SOURCE AND LIMITS
What this dataset can and cannot answer
Source fields are kept locally as normalized records. The raw World Bank responses are not retained in the project. Future updates must record the new source-response hashes, added, revised and deleted observations, and preserve nulls before a reviewed version can replace this baseline.